Venn Diagram was proposed in 1880 by John Venn. These diagrams are very useful tools to understand, to interpret and to analyze the information contained by the sets. The different region in the Venn Diagrams can be represented with unique mathematical notation. eg: (AUB), (AUBUC) etc.
Venn Diagrams are versatile type of graphics designed to communicate the relationships between sets.Such diagrams can be used in many fields including, but not limited to business world, projects and other fields. Information can be presented in a grasping and attractive manner by using Venn Diagram.
Venn Diagrams are pictorial or graphic representation of logical or mathematical set relations using circles and squares or rectangles to express the interrelationship between the sets.
Let us consider a universal set U= {1, 2, 3, 4, 5, 6, 7, 8, 9, 10} with sets A= {1, 2, 3, 4, 5} and B= {2, 4, 6, 8, 10}
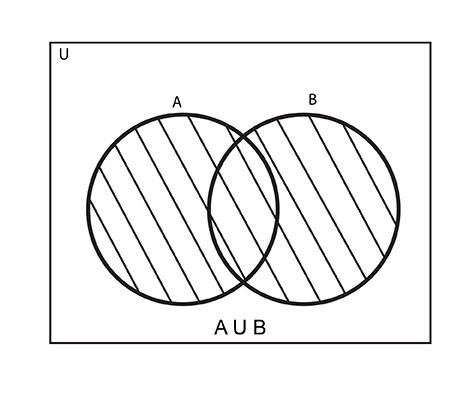
Venn Diagram for (AUB)
The below diagram shows the elements present in either of the sets A or B inside the shaded region. This region is known as the Union of the two Sets.
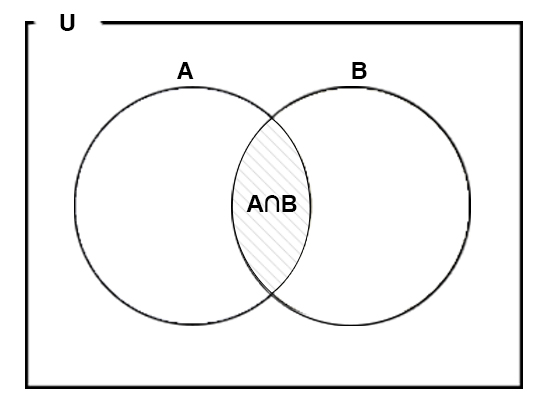
Venn Diagram for n(A∩B)
The below diagram shows the elements present in both of the sets A and B inside the shaded region. This region is known as the Intersection of the two Sets.
The overlapping areas between the two boundaries describe the elements which are common between the two, while the areas that aren’t overlapping house the elements that are different.
Venn diagrams are used often in Math. Thus, most people think that concept of Venn Diagrams are used only to solve Math problems.
How to Construct a Venn Diagram?
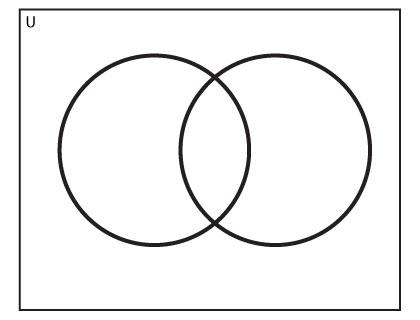
- Draw a Square or Rectangle
- Give its name as U ( U for Universal Set)
- Draw a circle for each set of interest.(The circles must be overlapping if the sets are known to contain common elements).
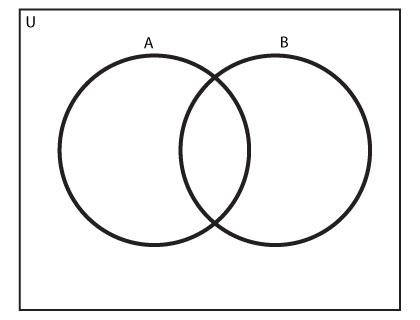
- Give names to the circles so that we can identify which circle represents which set.
- Plot the Elements as required. The elements that are present in more than one part should appear in the overlapping regions.
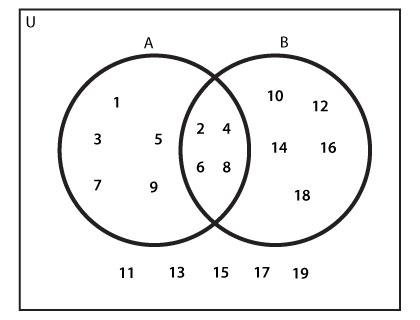
Note: While plotting the elements in a Venn Diagram,it is advised that you start with the elements that are common to most sets.)
Advantages:
- Venn Diagram shows all relationships between different sets within a universal set and provide a visual representation on the interrelationships between the sets.
- The graphic representation of the Venn Diagrams allows the viewer to grasp the information instantly without any confusion. It is easy to see which sets share common elements and which don’t.
- We can easily and logically solve difficult set numerical problems using Venn Diagram.